Human Spatiotemporal Transcriptomic Atlas
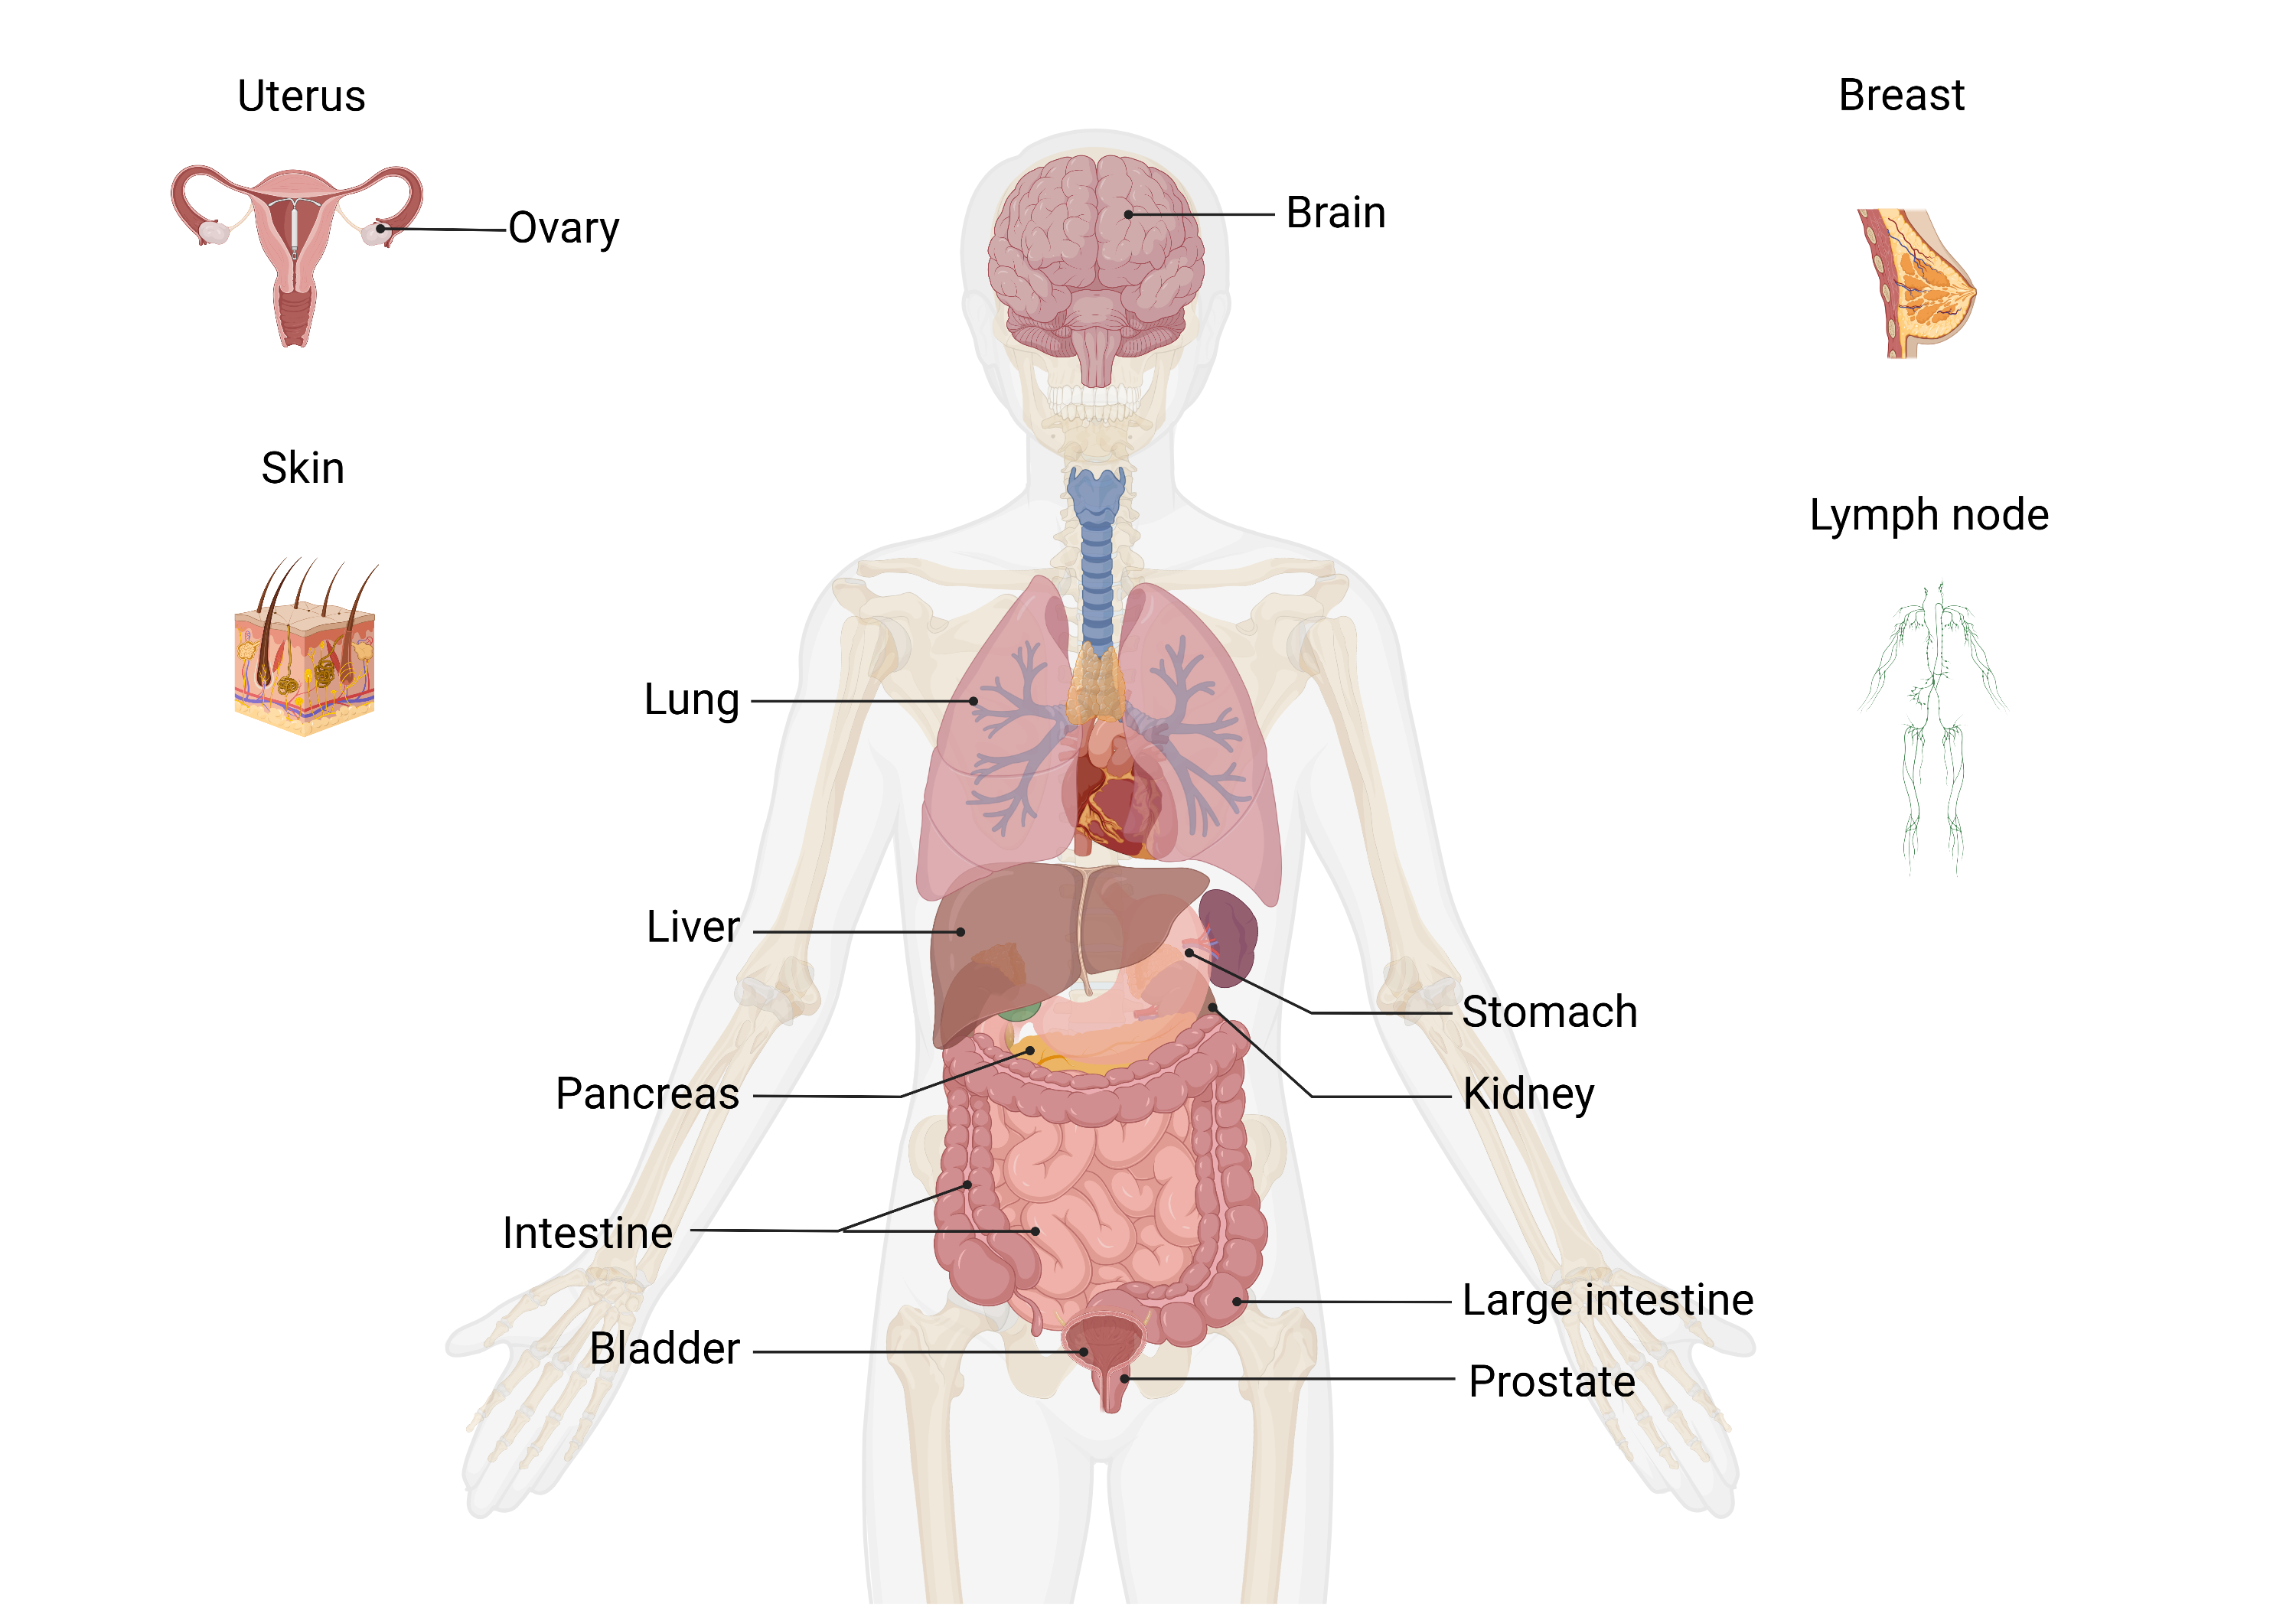
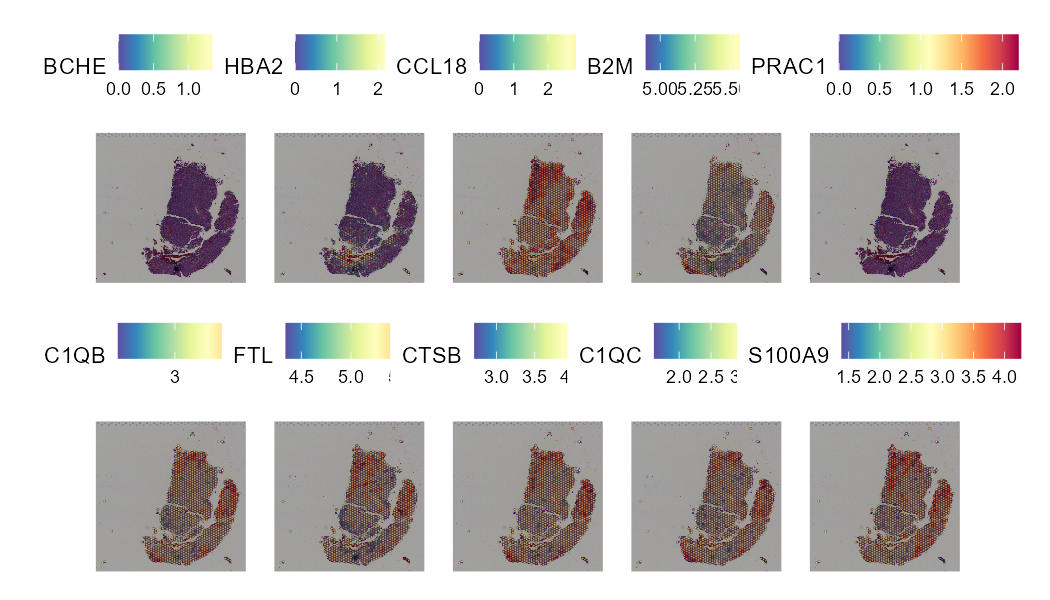
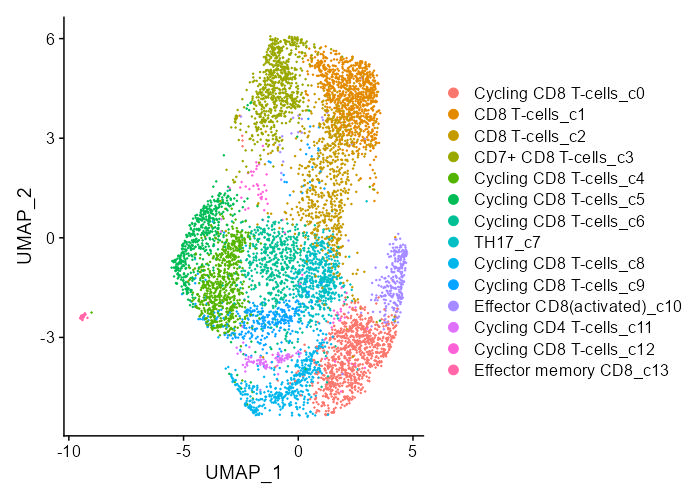
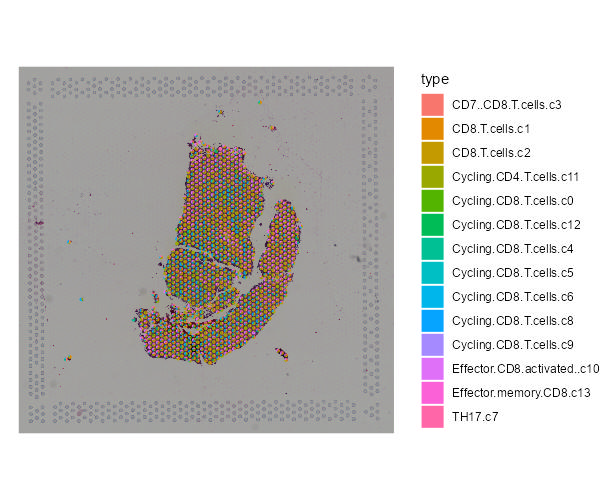
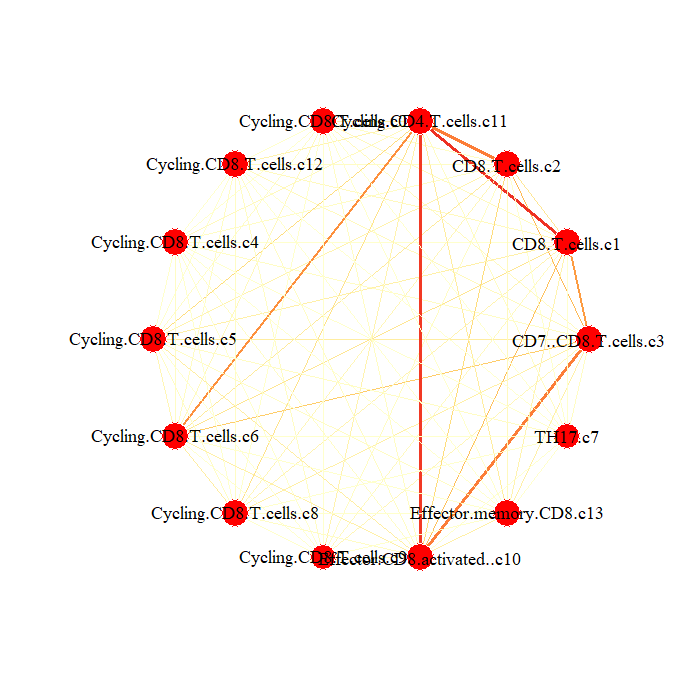
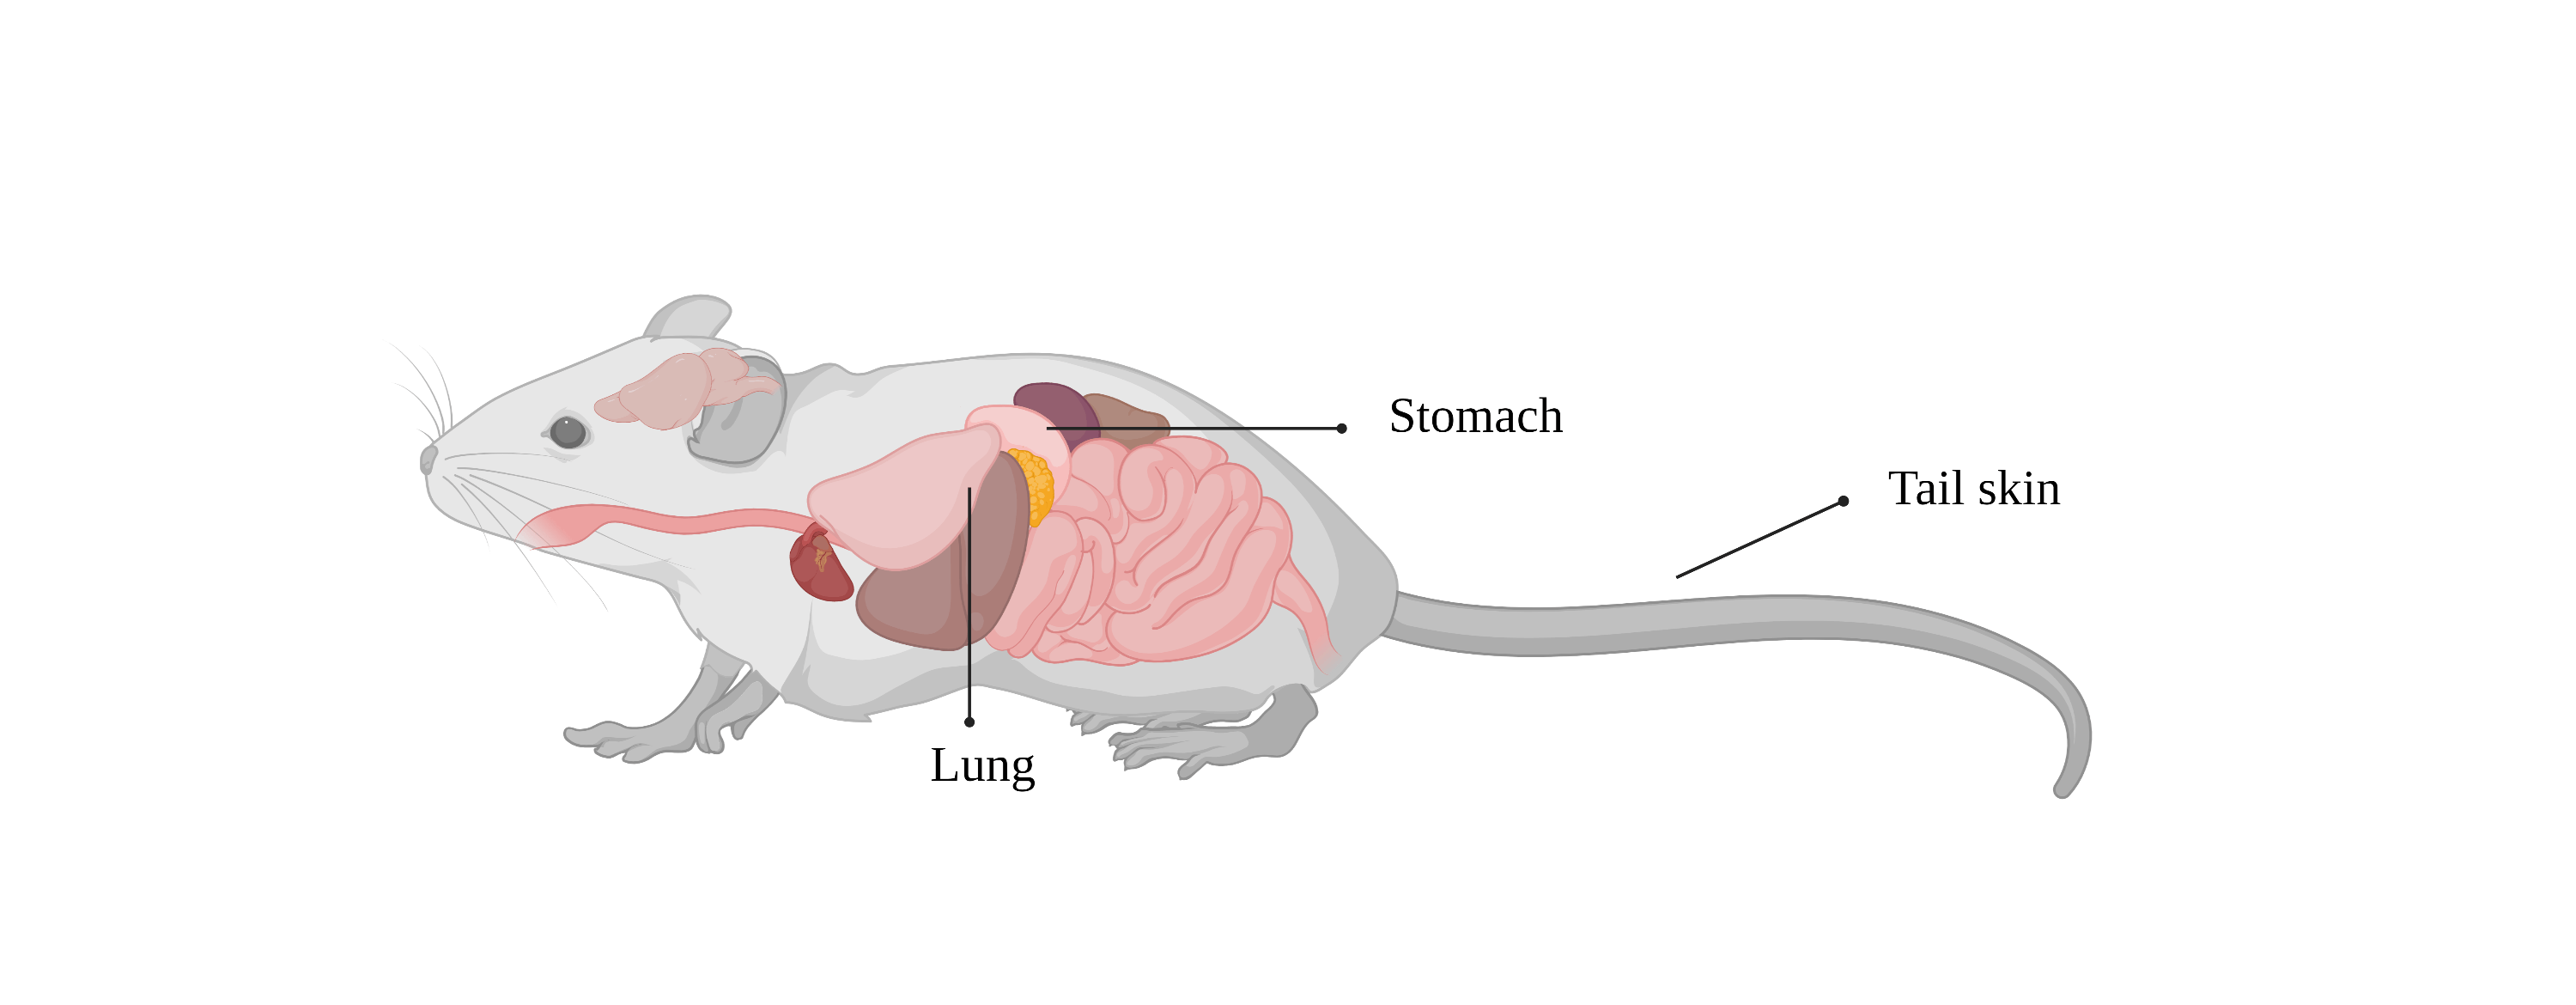
Spatial transcriptomics technologies can construct the spatial trajectory of tumors by analyzing the cell composition and their distribution in the tumor microenvironment and gain insight into tumor metastasis and invasion. The SCAR_ST module provides a spatial transcriptomics atlas for different types of cancer to improve understanding of tumor heterogeneity and provide new insights into cancer prevention, clinical diagnosis, and therapeutic approaches development.

| Species | Symbol | Ensembl | Expression pattern |
|---|